Drag-sensitive Sequential Wave Imprinting Machines - 23rd annual WaterHCI DECONference
I had the chance to put together something small and interesting for WaterHCI DECONference, a conference all about water and electronics, centering especially around AR/VR tech that elevate the underwater experience as opposed to becoming a sopping-wet Oculus-brand paperweight.
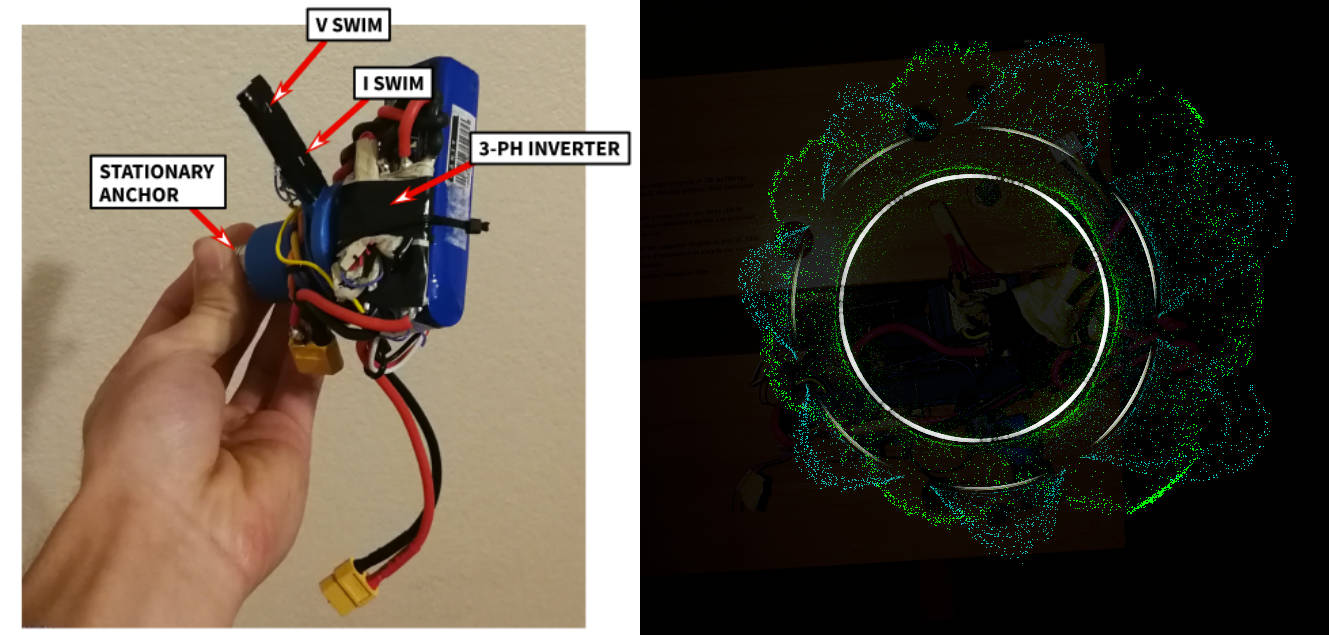
Flashback to a couple months earlier, where I threw together a small visualizer for motor waveforms to test out a 3-phase commutation algorithm for a reaction wheel. This visualizer was near and dear to my heart, based on the motor Sequential Wave Imprinting Machine (SWIM) out of MannLab that I had gotten to build on in some of my academic work. Given its lengthy name it can be explained in almost less space: just a light, modulated by the voltage or current energizing the motor. The light spins with the motor, and since over short times the motor waveforms are steady, your eye sees a stationary radial wave showing the motor's performance against true angle, and how it is affected by its environment.

SWIMs and you
©Steve Mann, sourced from wearcam.org
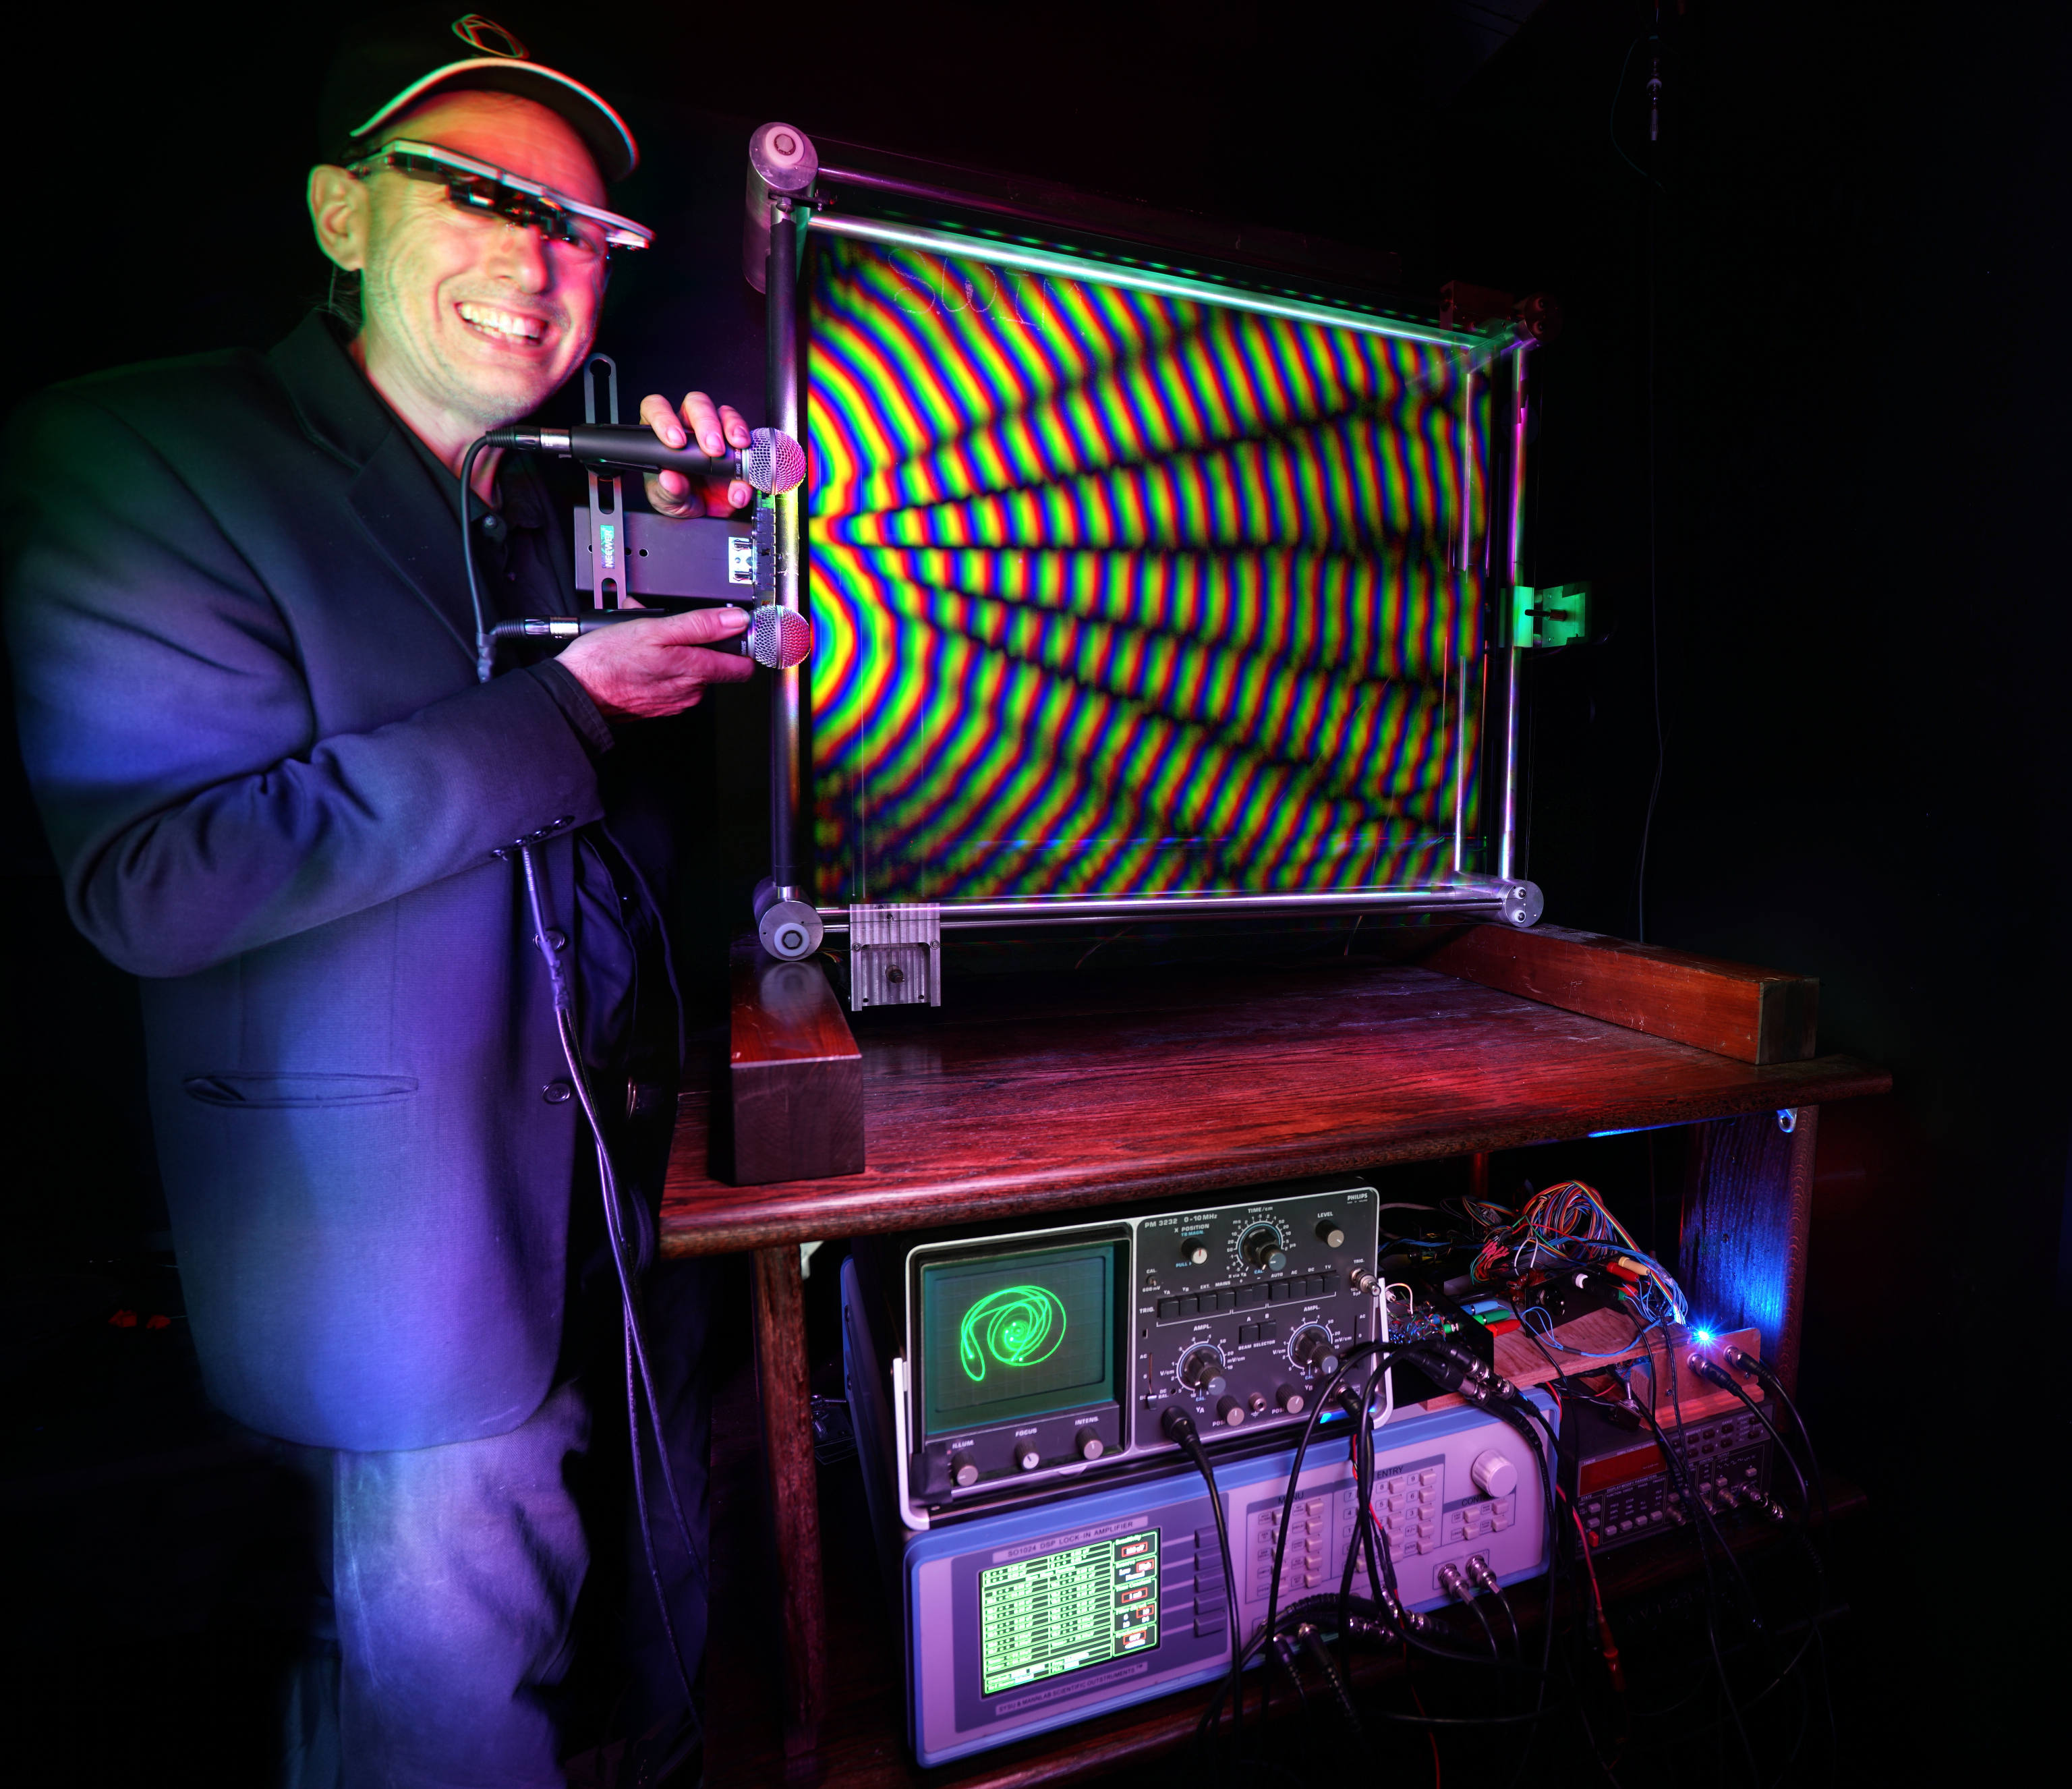
SWIMs in general are a powerful tool for making visible any spatial, [nearly] fixed-frequency waves, from radio waves to ultrasound to water. At its core, SWIMs sample the wave and calculates its phase offset to a reference signal at the frequency of interest. Once this phase offset is known, the full phasor (amplitude and phase) of the signal at that point in space is fixed and immediately visible, and one can move the SWIM around the wave source to map the phasor over space.
This phase offset is usually calculated by heterodyning the measured signal using the reference, but motor SWIMs are a special case. The speed of the time-varying current or voltage waveforms is exactly matched and opposite to the speed of the motor, so the waves are stationary in space! Very convenient, no filtering needed.
We have a nice paper on Xplore in the homely IEEE format if you'd like to read more about the design and the phenomenon. Below is a motor SWIM driven at varying speeds, which purely scales the waveform.
Like any graph, SWIMs need to display in some "axis" that is independent of the spatial axis of interest. Traditionally, SWIMs have been lines of LEDs, used to probe things along lines or planes. These are very easy to understand, as humans understand lengths better than angles, colors, intensities, and certainly without perspective warp. It's why line and bar charts beat out pie charts which definitely beat out 3D pie charts.
(Just about everything beats out 3D pie charts...)
Sometimes color and intensity are acceptable too. 2D SWIM maps use color and intensity often to display phase and amplitude like many complex-valued visualizations do.
©Steve Mann, sourced from wearcam.org
However, I was using the intensity of one LED solely practically: only one GPIO needed, no extra hardware needed. I "expanded" the intensity into a spatial wave separately with some realtime PIL+numpy video feed crunching for my convenience in viewing. At the speeds I was running tests, it sure showed useful for the SWIM to also avoid being a propellor.
And when I heard a water+tech AR/VR-focused conference was going down, I realized this problem was 1000x worse in water and slipped in a presentation for it there too! The rest speaks best for itself:
Conference presentation
High-resolution demo recording
Slides
- Intensity to radial mapping script